3D Cyberattack Visualiser
Running since October 2026 · 2,415 blocked attempts this month
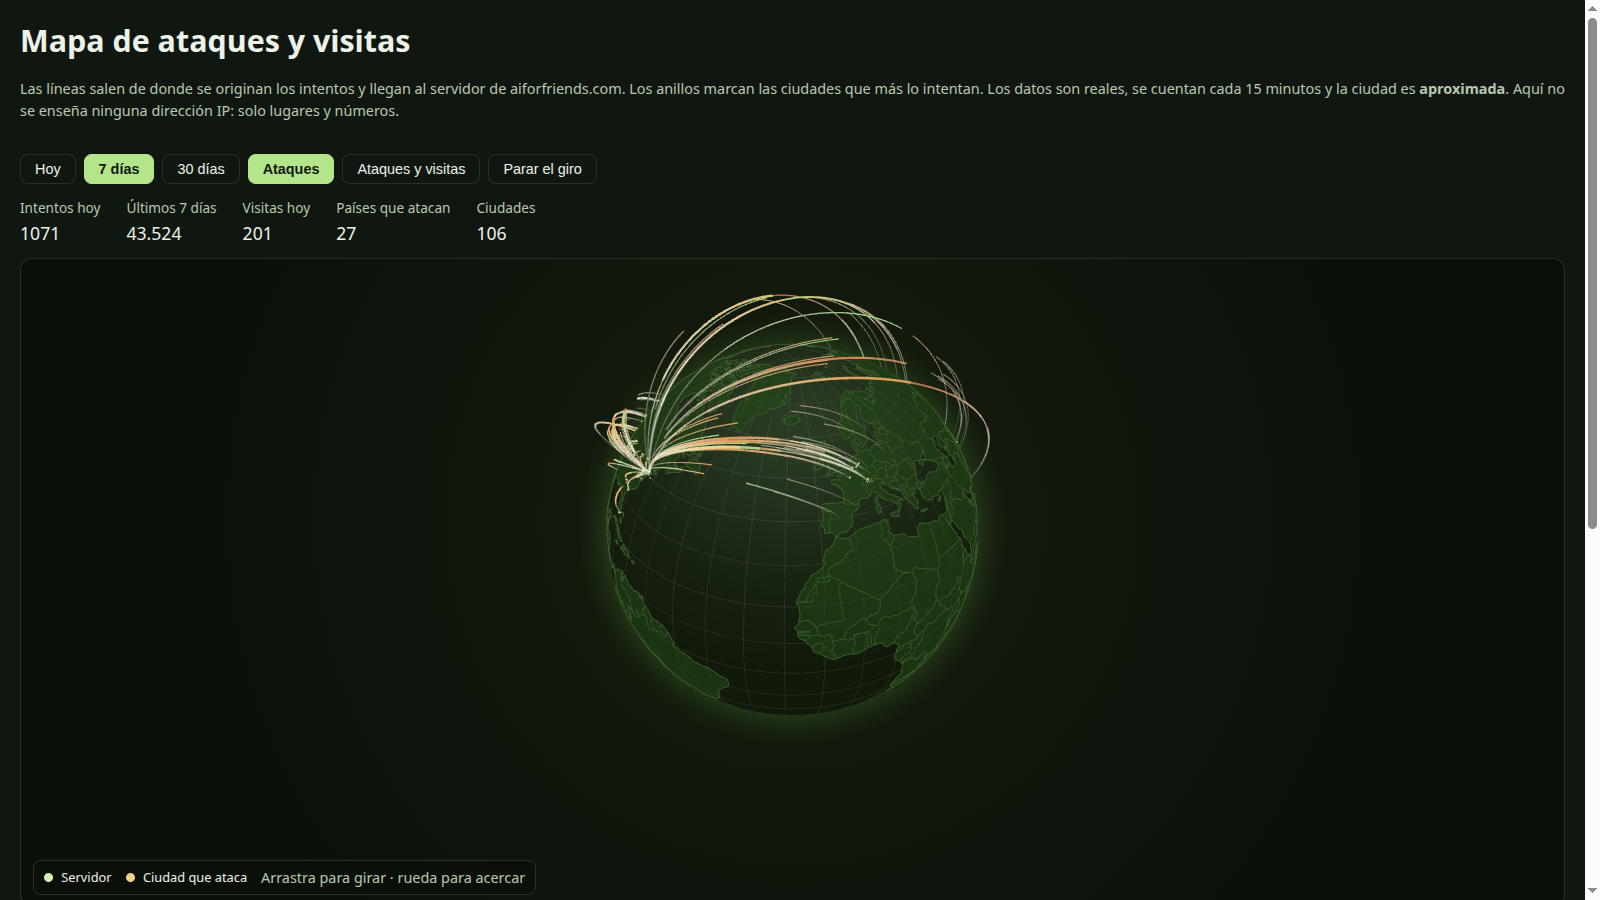
Every server connected to the internet receives login attempts every day. The numbers in a table say how many, but not where from or how. This viewer puts them on the map: a three-dimensional globe where you see each attempt leave its city for the server.
There is no API that says "attacks on my domain": the data comes from the server's own logs, counted every fifteen minutes, and from a free city database (DB-IP).
What it does, exactly
- Draws each attempt as a line from its city to the server, in the colour of the attack type.
- Marks the cities that try hardest with rings, and the server with a blue dot.
- Shows visits as green dots, if selected.
- Gives today's figures, seven-day and thirty-day, with the countries and cities involved.
- Lets you choose today, seven or thirty days, spin or stop the globe, and see only attacks or also visits.
- Shows no IP address: only cities, countries and numbers.
How it is built
Next.js application inside the same container as the OSINT panel. The globe is drawn with globe.gl, on top of Three.js, under the MIT licence, and loads only when the map is opened so as not to make the application heavy.
The data comes from the Traefik access log: grouped by city and type every fifteen minutes and stored in PostgreSQL. The city and its coordinates come from the DB-IP city database (7,786,864 ranges), which is free and credited.
The map has its own address, mapa.aiforfriends.com, and a public API that returns only aggregated data. The country outlines are from Natural Earth (public domain) and travel with the website itself: nothing is requested from any outside service.
What can be seen from outside, and what cannot
You see: cities, countries, coordinates, attempt types and the figures for each period.
You do not see: any IP address, any requested route and anything that would identify a person. The city is approximate, because the free DB-IP database is less precise than the paid one, and the screen itself says so.